Input
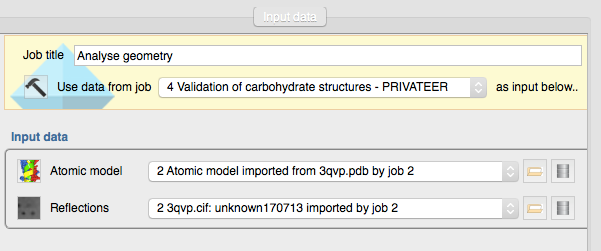
Fill this window with reflections and the model you want to analyse.
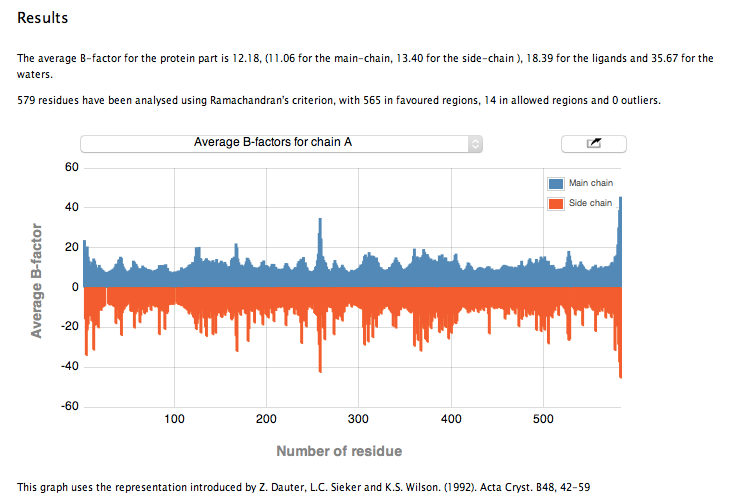
This graph shows the average B-factors, separated by main chain and side chain. For clarity reasons, the side chain B-factors are shown with inverted sign.
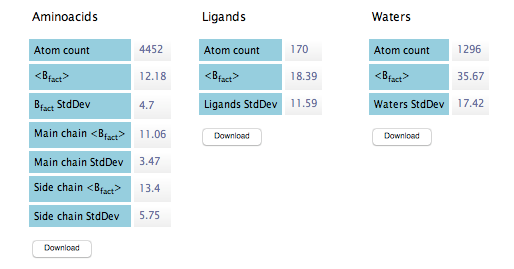
This table shows B-factor information for Table 1.
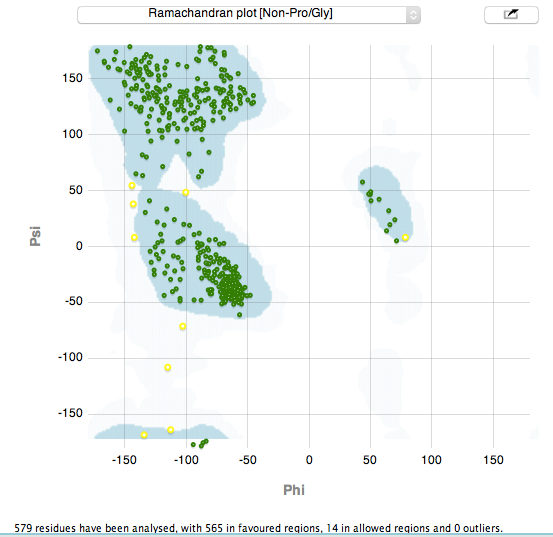
This graph shows a Ramachandran-style plot, separated by non-Proline and non-Glycine, Proline and Glycine. These plots are generated with the Richardsons' Top 500.